100% database utilization every second day continuing for several days

Hi,
I have moved a local teamcity server installation into azure cloud on a virtual machine and using an azure SQL DB.
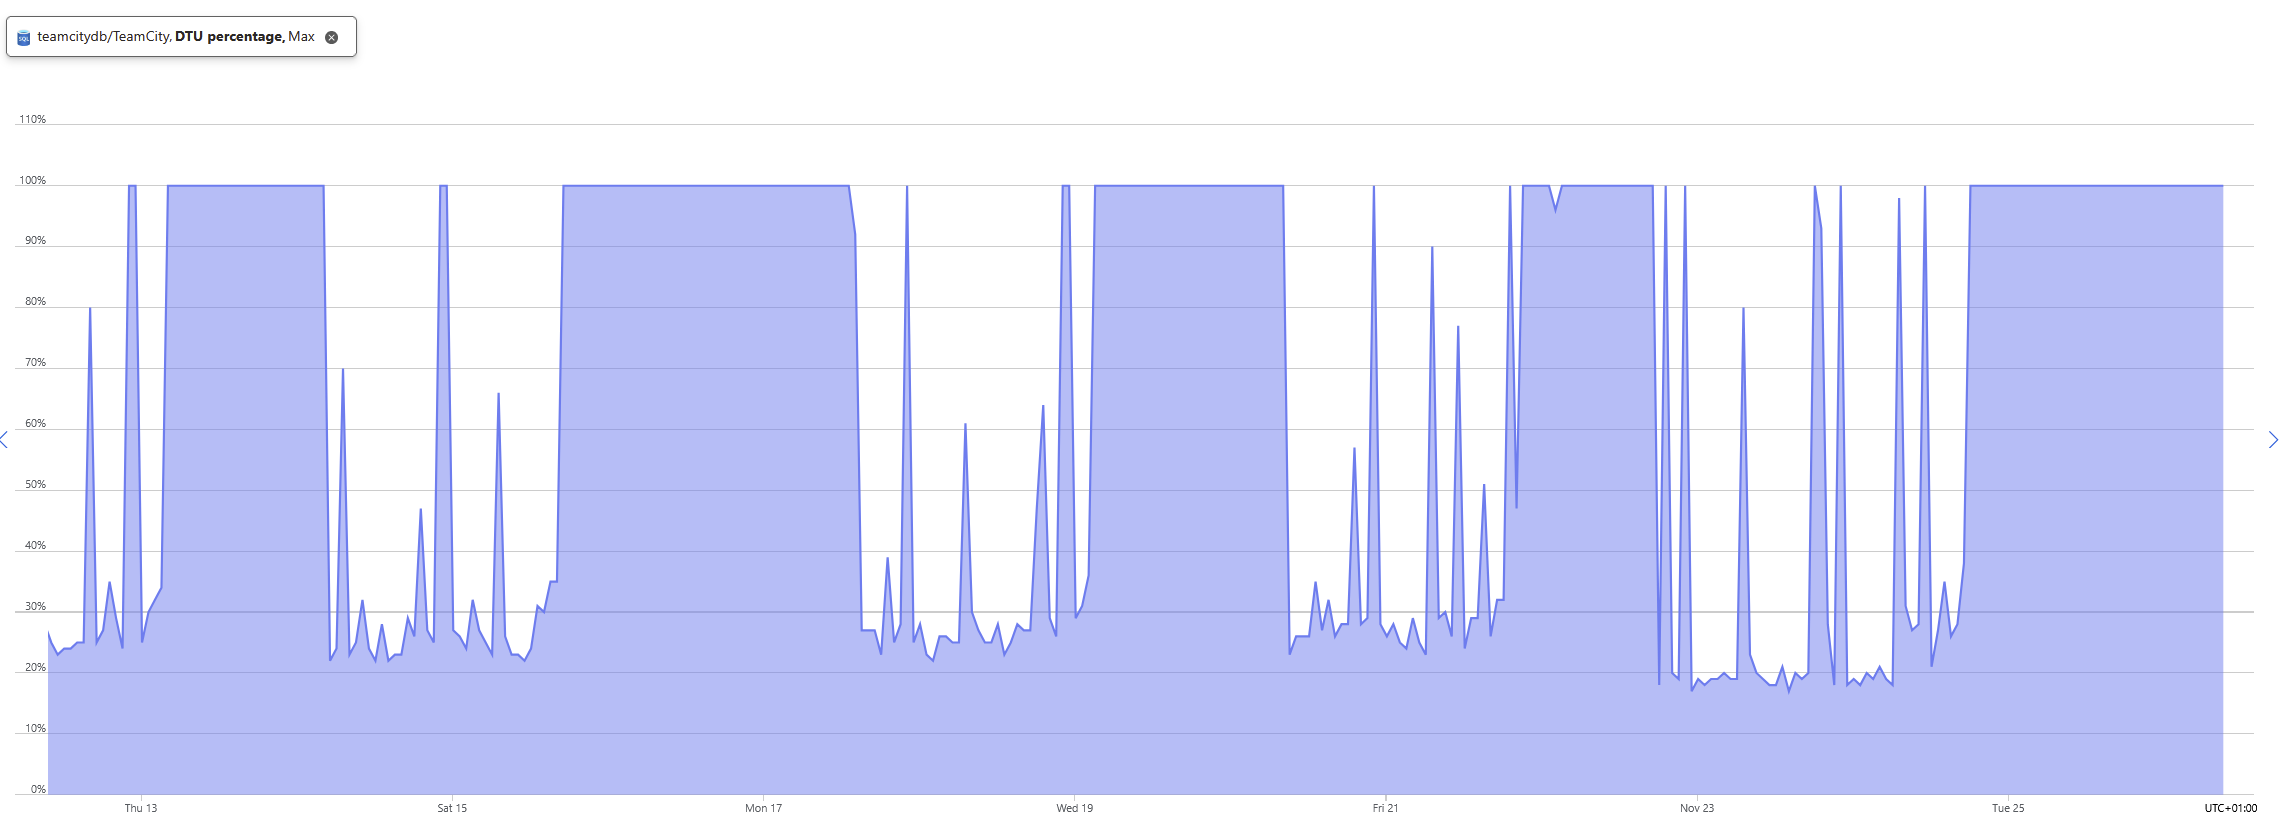
I have noticed that every now and then the database is fully utilized for 2 days, it seems to happen 2 days with normal usage and approx 2 days fully utilized (using a standard S0 10DTU DB). When the DB is fully utilized teamcity becomes unresponsive, I have let teamcity finish whatever it is doing to see if it was optimization or clean up, but it continues happening. If I restart the teamcity service, everything works as expected afterwards, so it doesn't seem to be the DB that is acting up as it would be expected that after the restart it would still be a problem then.
The below screenshot shows the periodic behavior.
I have looked at the logs: cleanup, diagnostics activities, maintenance and server log and cannot see anything happening when this starts occurring.
Drilling down in the sql log of teamcity doesn't give me any insights other than starting to notice queue takes longer to execute.
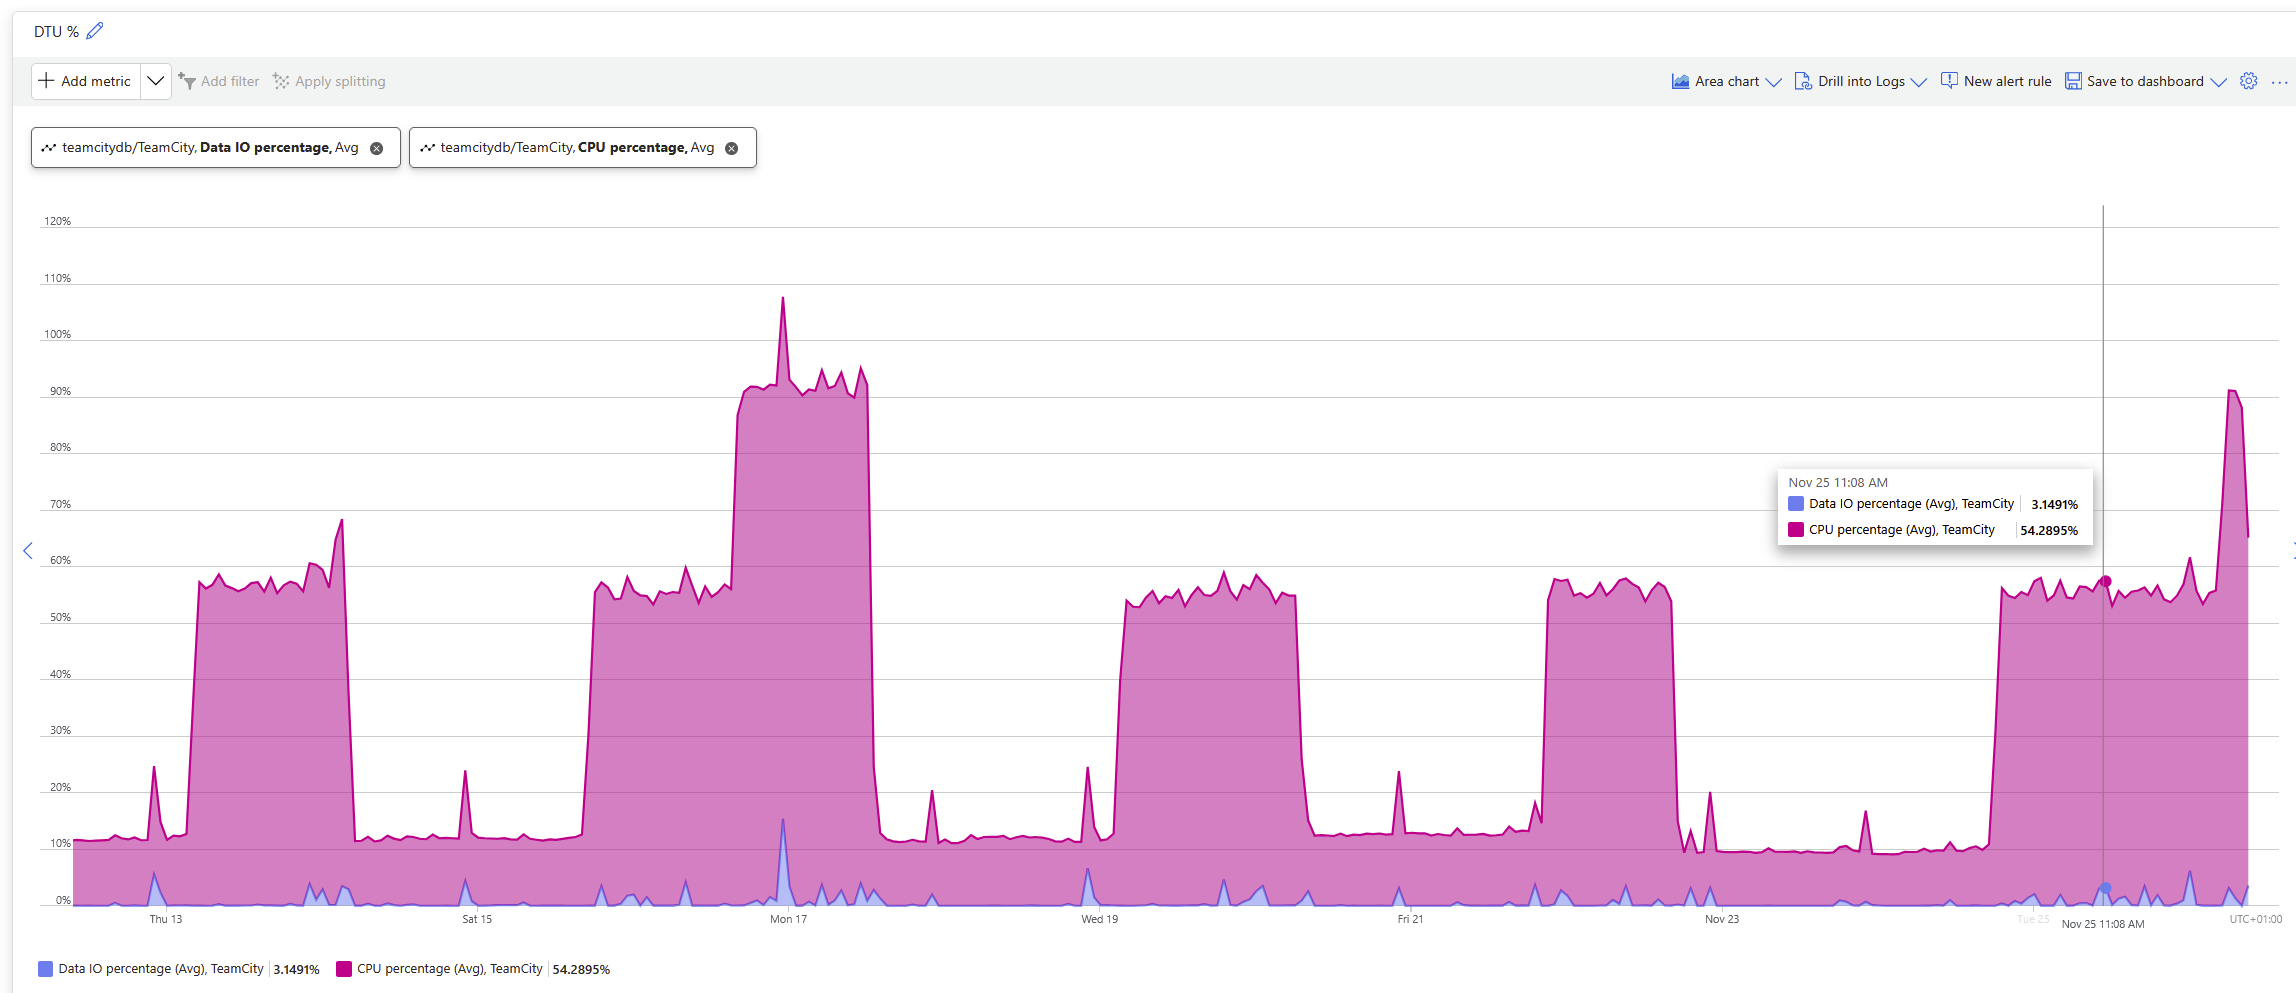
This does not seem to be related to IO either, looking at below graph it can be see that IO doesn't seem to peek at that specific time when the problem occurs.
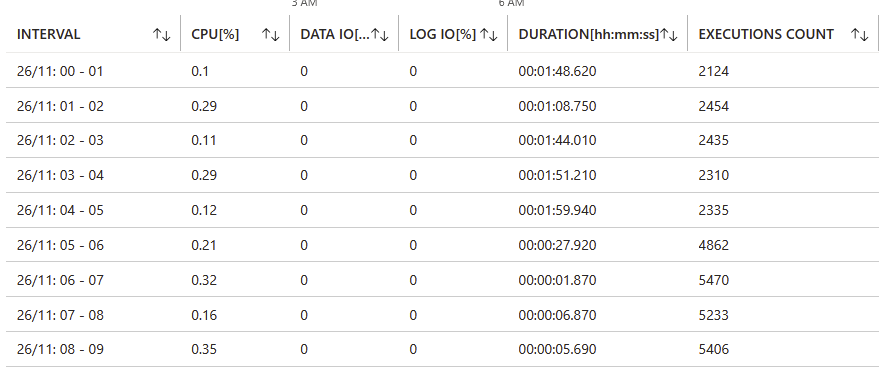
Looking into the specific queues that are triggered often, it seems like they triggers less often due to them taking longer time but they increase in total time running. Example:
(13:45:34, global_settings) 1 - [1ms] SQL SELECT: select top(1) id, task_type, description, stage, node_id, created, updated from config_persisting_tasks where task_type = ? and stage in (?,?,?) order by id | PARAMETERS: "global_settings", 1, 2, 6The execution count increases after the DB is back to normal and totoal duration decreases.
I currently doesn't have the teamcity sql log file from when this started happening, as they have all been overwritten.
Does anyone have any clue to what might be going on or any suggestions where to go from here ?
Please sign in to leave a comment.
teamcity-sql.log should help identify the cause.
Could you let the issue reproduce so that the logs are not rolled over, upload all logs from the TeamCity server to https://uploads.jetbrains.com/ and share the upload ID? I'll see what I can find.
Best regards,
Anton
Thanks for the quick response.
It will happen again in a couple of days I guess, as I have seen this pattern over the last month. I will provide the SQL log files at that time. I cannot trigger it, it happens at more or less a scheduled time from restart or from last time it happened.
I will get back to this thread when it happens next time.
Regards
Dennis
Hi Anton Vakhtel
I have experienced it again and have uploaded the files, the upload ID is: 2025_12_02_UFNGSBtc7o4GSpvX77XGy7
Given the timestamps in the files and the DB performance graph it seems to ramp up around 8:43, this time it doesn't jump as previously, seems more like a slower ramp up.
Regards
Dennis
I'm yet unable to identify the cause from SQL logs.
TeamCity should automatically create thread dumps when performance issues are encountered. Could you check for the automatically created thread dumps in the TeamCity logs directory?
On a side note, I also see that you have a debug logging profile enabled. We highly recommend using the Default logging preset during normal TeamCity operation.
Best regards,
Anton
Hi Anton,
I have compressed the complete directory of thread dumps for that day Upload id: 2025_12_05_22MrTm7WBb2D9J1Quq5it9 (file: threadDumps-2025-12-02.zip), if it posses a security issue with the zip file please let me know.
I was just hoping that the debug logging with give some extra insight to what was happening, when everything is as normal I will revert back.
I'm sorry for the wait.
I'll also consult with the team regarding the provided thread dumps, but as of now, I can only see obvious SQL-related threads being out of the norm.
In the meantime, could you check the following?
1. The MS SQL database is configured as described in https://www.jetbrains.com/help/teamcity/setting-up-teamcity-with-ms-sql-server.html#Create+New+Database (i.e., collation, "no count").
2. What is the version of the MS SQL JDBC driver you are using?
3. Is it possible that the DB may have high fragmentation? Please refer to https://learn.microsoft.com/en-us/sql/relational-databases/indexes/reorganize-and-rebuild-indexes?view=sql-server-ver17&redirectedfrom=MSDN#Fragmentation
I will get back to you as soon as possible.
Best regards,
Anton
Please also provide all server logs when the issue is reproduced again. Maybe something will become clear from other logs.
Best regards,
Anton
It looks like the issue may be in a DB server's CPU. We suggest using a more powerful CPU on the DB machine.
Please also check the network distance between the database and the TeamCity server instance. Please measure it with ping and provide the results.
Best regards,
Anton
Hi,
Sorry about late response, I just returned from leave.
If this was a CPU problem on the DB I guess it would be a constant problem and not something that occurs every second day ?
When CPU isn't fully loaded, there is plenty of CPU and restarting TeamCity when it is a problem everything returns to normal, so it must be triggered by something from TeamCity as it a pattern that occurs at given intervals and furthermore isn't a problem after restarting teamcity service. If it was a DB problem I would expect the problem to continue after a restart of TeamCity.
Furthermore, these servers are not far from each other which below ping shows:
Thanks for checking the latency, it's OK.
The cause being in the DB performance makes sense because the request queue builds up during use and flushes when you restart the server.
Best regards,
Anton