Multiple builds stuck after publishing artifacts
Hi,
We are experiencing some issues with a subset of our builds; every so often, a build will hang indefinitely after having run all steps successfully.
The last entries in the build log always read:
[09:06:21][Publishing artifacts] Publishing using [ArtifactsCachePublisher]
[09:06:21][Publishing artifacts] Publishing using [WebPublisher]
[09:06:22][Publishing artifacts] Publishing using [ArtifactsCachePublisher]
[09:06:22][Publishing artifacts] Publishing using [WebPublisher]
The artifacts we've specified for collection are dealt with slightly earlier, and are available as expected (even before the build is marked finished).
We've only experienced these issues on one specific agent - other machines have not exhibited the problem. Efforts to find out why this might be the case have been in vain.
We're unable to retrieve a thread dump from the agent as the co-ordinator marks it as idle after all build steps are complete. However, a server thread dump reveals the following:
"TC: 09:58:59 Finishing build: 191738; 09:58:59 Task started; Normal executor 3" group="main" prio=5 tid=119 nid=119 waiting on java.util.concurrent.locks.ReentrantLock$NonfairSync@220d2489
by "TC: 09:31:56 Task started; Scheduled executor 3"
java.lang.Thread.State: WAITING
at sun.misc.Unsafe.park(Native Method)
at java.util.concurrent.locks.LockSupport.park(Unknown Source)
at java.util.concurrent.locks.AbstractQueuedSynchronizer.parkAndCheckInterrupt(Unknown Source)
at java.util.concurrent.locks.AbstractQueuedSynchronizer.acquireQueued(Unknown Source)
at java.util.concurrent.locks.AbstractQueuedSynchronizer.acquire(Unknown Source)
at java.util.concurrent.locks.ReentrantLock$NonfairSync.lock(Unknown Source)
at java.util.concurrent.locks.ReentrantLock.lock(Unknown Source)
at jetbrains.buildServer.buildFailures.BuildFailurePeriodicalChecker.stopPeriodicalCheck(BuildFailurePeriodicalChecker.java:12)
at jetbrains.buildServer.serverSide.impl.RunningBuildImpl.finish(RunningBuildImpl.java:207)
at jetbrains.buildServer.serverSide.impl.RunningBuildsManagerImpl.finishBuild(RunningBuildsManagerImpl.java:123)
at jetbrains.buildServer.serverSide.impl.RunningBuildsManagerImpl$2$1.run(RunningBuildsManagerImpl.java)
at jetbrains.buildServer.util.NamedThreadFactory.executeWithNewThreadName(NamedThreadFactory.java:89)
at jetbrains.buildServer.serverSide.impl.RunningBuildsManagerImpl$2.run(RunningBuildsManagerImpl.java)
at java.util.concurrent.Executors$RunnableAdapter.call(Unknown Source)
at java.util.concurrent.FutureTask.run(Unknown Source)
at java.util.concurrent.ThreadPoolExecutor.runWorker(Unknown Source)
at java.util.concurrent.ThreadPoolExecutor$Worker.run(Unknown Source)
at java.lang.Thread.run(Unknown Source)
"TC: 09:06:25 Finishing build: 191734; 09:06:25 Task started; Normal executor 2" group="main" prio=5 tid=117 nid=117 waiting on java.util.concurrent.locks.ReentrantLock$NonfairSync@59ea022a
by "TC: 08:43:15 Task started; Scheduled executor 1"
(same call stack)
"TC: 09:31:05 Finishing build: 191736; 09:31:05 Task started; Normal executor 8" group="main" prio=5 tid=314 nid=314 waiting on java.util.concurrent.locks.ReentrantLock$NonfairSync@227c29c2
by "TC: 09:07:15 Task started; Scheduled executor 2"
(same call stack)
This tallies with what we see on the projects page (in this case, 3 running builds belonging to the same agent):
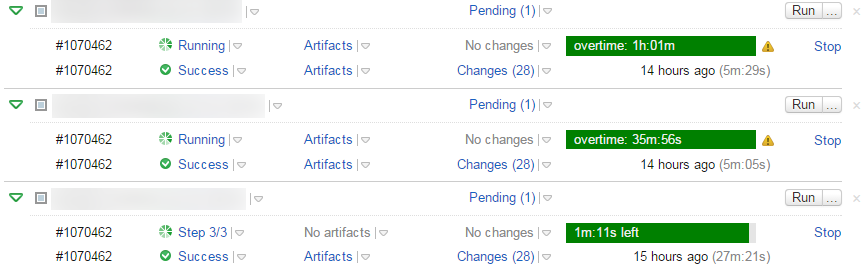
Sometimes the builds will complete after several hours of overtime; sometimes we have to manually remove them from the "running" database table as they 'cannot stop'. The latter is not enjoyable!
A complete reinstall of the agent software unfortunately did not help.
We are running TeamCity Enterprise 9.0.4 (build 32407). Any help would be much appreciated.
Thanks,
Jon
Please sign in to leave a comment.
Hi Jon,
Please attach teamcity-server.log and teamcity-agent.log from the affected agent. Also several thread dumps of the hanging agent process. You can use jstack util: https://confluence.jetbrains.com/display/TCD9/Reporting+Issues#ReportingIssues-Threaddumptakingapproaches.
Hi Alina,
Here are the agent (named 'PROST') and server logs starting from around the time I triggered the build in question. Some data has been anonymised (replaced with "...") but the build we're debugging is labelled 'build_of_interest'.
I've also attached the public build log along with several thread dumps from the agent, which were taken once the build appeared to be finished and the artifacts were available (see timestamps). I suspect the issue is server-side so I'm not sure they'll reveal much, but I hope I'm wrong!
Note the 2 hour delay before "Build finished" appears. It's worth pointing out that the agent was disabled, so no other builds were permitted to run on it during this time.
Thanks,
Jon
Attachment(s):
thread_dumps.zip
teamcity-server.log.zip
teamcity-agent.log.zip
build_log.txt.zip
Jon,
Indeed, this is server side issue regarding build failure conditions.
Could you please attach a full server thread dump and tell what "Buil failure conditions" are configured for the build?
Here's the full dump from my first post where 3 builds were not completing. I don't have another for last night's bug repro but I can get a new one if necessary.
:<br/><a%20href=) server_threads.txt.zip
server_threads.txt.zip
The failure conditions are:
-double post-
did this ever go anywhere? im seeing this exact behavior
In the end we disabled and removed that agent, no solution was found.
Hello James,
Could you please attach agent and server logs? You can use "Submit a request" button on the top to send all the files privately.
hi alina, i submitted a separate ticket and was able to resolve my issue. there was a rogue wildcard .* at the beginning of a regex failure condition that was causing my server CPU to max out. once i removed this, all was well.